







Ready To Learn?
Revel Systems Management Console Access


Summary
The Revel System Management Console where you will go to perform certain tasks such as running reports, viewing products and pricing, maintaining employees and payroll, and more. This web based backoffice is available on any device connected to the internet.
To log into the Management Console, visit https://primohoagies.revelup.com and input your email address and password. Once connected, you can navigate each area with the tab icons across the top and additionally with any corresponding tabs listed down the left side. If you have multiple establishments, use the blue tab arrow on the far left to navigate between the available establishments or select the main group to view all at once.

Main Tabs Descriptions
Overview: This section is made up of three quick-glance figures for the day which include the Payments Overview Chart, Customer Insights Graph, and Labor Stats Card.
Reports: This is where you will find any and all financial information about the business including Sales Summary reports, Operations reports, Payment Summary reports and more.
Products: All products and modifiers are located under this tab. Though everything under this section is controlled by the corporate database, you may view your products and modifiers names, pricing, details and more. Any changes to this tab need to be requested of DBS.
Inventory: DBS administration only.
Employees: Here you can add new employees to your database, assign roles and wages, or update existing employees.
Schedules: This tab includes a page for adding basic employee schedules, a page for logging and reviewing time worked, and a page for tracking payroll hours, wages, and employee tips.
CRM: DBS administration only.
Establishment: DBS administration only.
Revel Guard: DBS administration only.
Settings: DBS administration only.
Support: DBS administration only.
Updated 10/03/2022

Summary
The Overview tab gives you a quick insight to payments, customer insights, and labor costs. This data is a reflection of real time transaction data for your business.

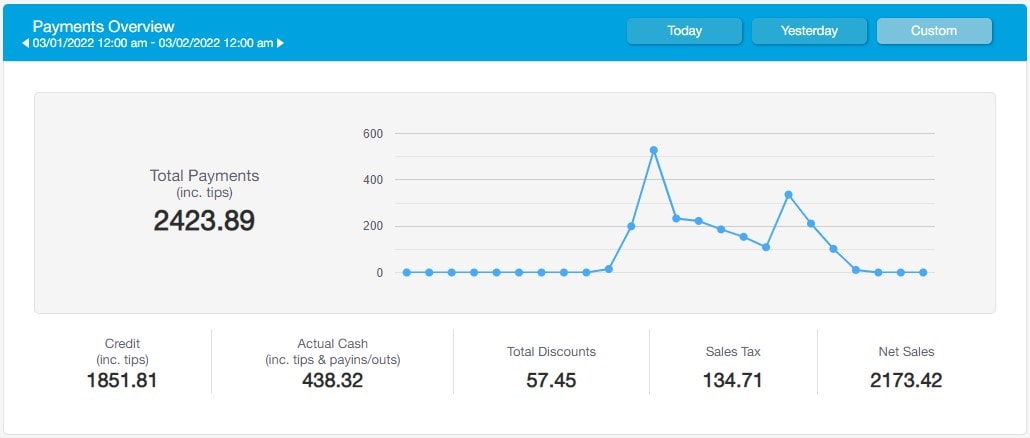
Payments Overview
The Payments Overview shows you your total payments (including tips), discounts, taxes (after voids and discounts), and net sales taken for the day. This includes cash, credit, and gift cards sales.
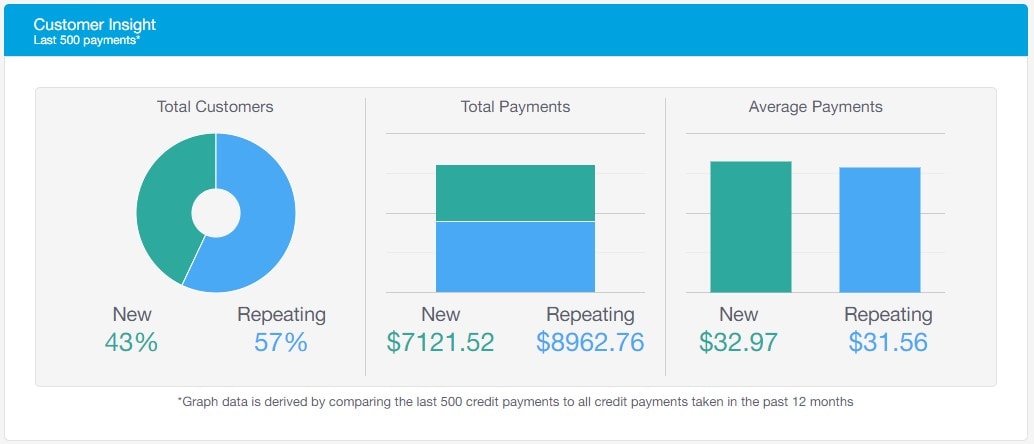
Customer Insights
The Customer Insights displays credit card data based on repeating or new customers. If a customer uses the same credit card more than once at your establishment, they will fall under the repeating customer category. The graph data is derived by comparing the last 500 credit payments to all credit payments taken in the last 12 months.
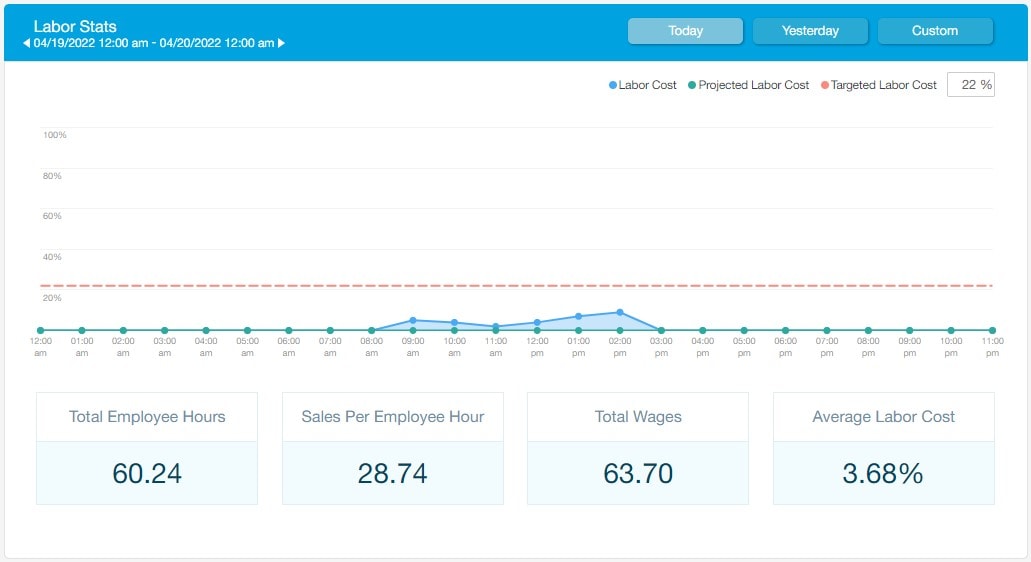
Labor Stats
Use the Labor Stats to view a summary of the total hours worked, wages, and average labor cost. Keep in mind that this card shows projected data and includes any salaried employees as well as hourly employees that access the point of sale.
Updated 10/03/2022

Summary
The Sales Summary Report provides detailed insight from the daily sales, including fees, discounts, taxes, liabilities, and payments.
From the Management Console select Reports > Sales Summary.

Filtering The Report
This report contains multiple filter options including filtering by Date Range dropdown, and the Filters button. Use the Filters button to choose POS Stations, Employees, Online Orders & Inclusions you want to see in the report.
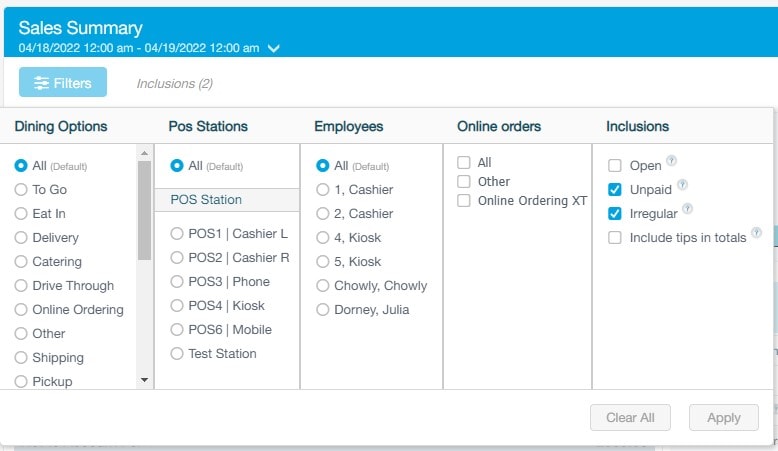
Exporting Data
Use the elipsis icon on the top right to export the reporting data to various formats or send to a printer.
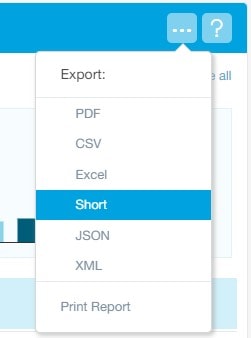
Sales Graph
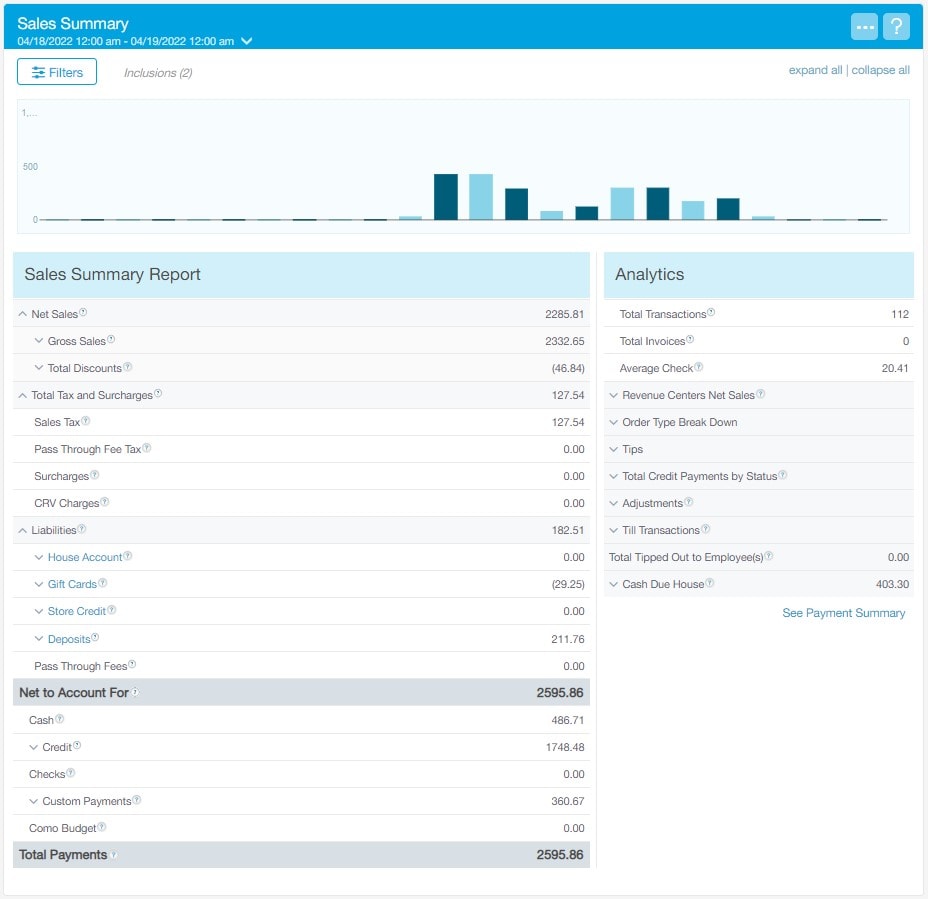
The graph at the top of the report displays the sales for your selected time range. Each bar signifies a particular day. Hover over a bar to see the date along with the Net To Account For amount.

Report Data
Certain sections of the Sales Summary Report can be expanded or collapsed individually based on your preference or use the quick expand all and collapse all links located at the top right of the report. Additional details of an item can be found by hovering over any blue question mark next to the item. A summary of the most common reporting sections and calculations is provided here:
Net Sales: Gross Sales – Total Discounts
Total Tax and Surcharges: Sales Tax + Pass Through Fee Tax (example: taxes paid to third party delivery services) + Surcharges
Liabilities: Total activity affecting liabilities. Both activities that increase liabilities (including the sale of gift cards or the taking of a deposit on a future order invoice) and activities that decrease liabilities (including the use of gift cards or payments against house accounts). Pass Through Fees and Store Credits are also shown under liabilities.
Net To Account For: Total of Net Sales + Taxes + Liabilities
Analytics
The components of the Analytics section provide additional insight into your sales during the selected reporting period and include:
Total Transactions: This total is the number of orders opened during the reporting period.
Total Invoices: This is the total amount of future orders (referred to as Invoices in Revel) opened during the reporting period.
Average Check: This is the average net sales per order during the reporting period.
Order Type Break Down: Revel breaks down this section based on the available order types in the system. This section will include all order types, regardless if they are being used or not in your business. *Note: The Pickup order type refers to any order placed online for pickup in the store while the Pick Up order type is any order placed in the store (typically by phone) and placed with a cashier. Each order type functions differently such as how they print to the kitchen, etc.
Tips: All tip breakdowns by Payment Types, Liability Tips, and Declared Tips.
Total Credit Payments by Status: Broken down into Accepted, Captured, and Declined. By default, payments from online ordering are “Captured” automatically while payments at the POS are “Authorized” and will be captured during the End of Day process.
Adjustments: Summary totals of activity which decrease sales and/or payment amounts. These include Voids, Returns, Comps, and Refunds.
Till Transactions: A summary of activity affecting the amount of cash in the tills. This includes Payins, Payouts, and Safe Drops.
Cash Due House: The amount of money owed to employees by the house or vice versa. If the amount is negative, it is owed to the house. If it is positive, it is owed to the employees. Generally speaking, it is non-cash tips less cash, but may also include payins and payouts according to report settings.
Updated 10/03/2022

Summary
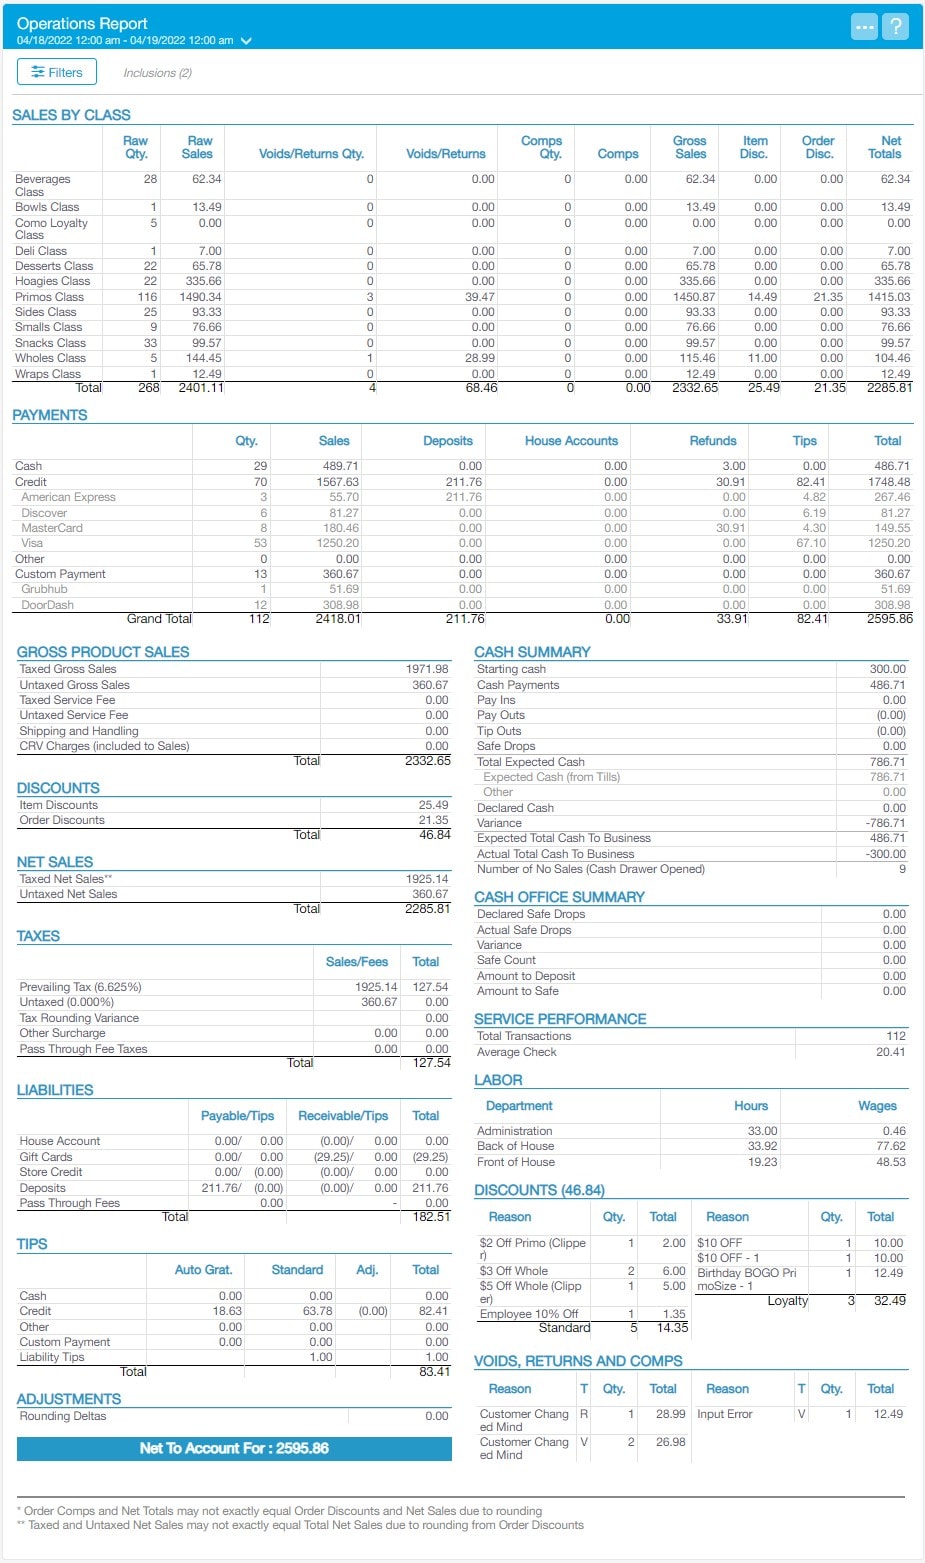
The Operations Report is a combination of various reports all rolled into one. Instead of going into each individual report, this report reconciles the essentials from each report into one large report.
From the Management Console select Reports > Operations Report.

Filtering The Report
This report contains multiple filter options including filtering by Date Range dropdown, and the Filters button. Use the Filters button to choose POS Stations, Employees, & Inclusions you want to see in the report.
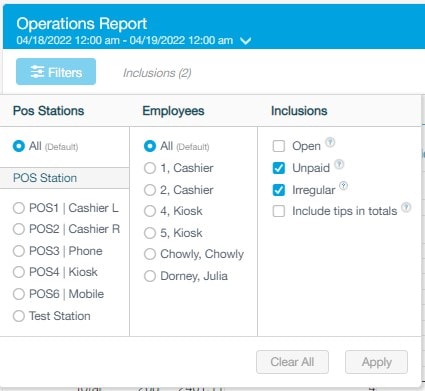
Exporting Data
Use the elipsis icon on the top right to export the reporting data to various formats or send to a printer.
Report Data
Each section of the Operations Report shows a summary of the related information. To navigate to the full corresponding individual reports, select any of the blue section headings.
Sales By Class: This section displays the quantity and sales for each product class.
Related Report: Product Mix Report
Payments: Displays all payment methods and the amount collected for each method. The Payment Grand Total line will equal the Net To Account For in the Sales Summary Report.
Related Report: Payment Summary Report
Gross Product Sales: Displays all Taxed Gross Sales, Untaxed Gross Sales, Taxed Service Fees, and Untaxed Service Fees.
Related Report: Sales Summary Report
Discounts: Displays all Item Discounts and Order Discounts. Most discounts will fall under Order Discounts.
Related Report: Discounts Report
Net Sales: Displays all Taxed Net Sales and Untaxed Net Sales. Net Sales are calculated as the Gross Sales minus Discounts.
Related Report: Sales Summary Report
Taxes: Displays add different taxes, their rates, and how much was collected.
Related Report: Tax Report
Liabilities: Displays all liabilities, such as deposits made to future orders (invoices), gift card purchases, store credit purchases, and PrimoCares donations.
Related Report: Sales Summary Report
Tips: This section will display all cash tips, credit card tips, other tips, and custom payments tips. It also displays any auto gratuities, adjustments to tips, and the total tips.
Related Report: Sales Summary Report
Adjustments: Summary totals of activities which decrease sales and/or payment amounts.
Related Report: Sales Summary Report
Cash Summary: Displays total cash payments, payins, payouts, and any cash deposits.
Related Report: Tills Summary Report
Service Performance: Displays the total transactions taken, the average per order, total guests (one per order), and the average sale per guest.
Related Report: Sales Summary Report
Labor: Displays the amount of wages paid out based on the hourly rate of each employee.
Related Report: Labor Report
Discounts: Displays the reason, quantity, and the total for all discounts.
Related Report: Discounts Report
Voids, Returns, Comps and Exchanges: Displays the reason, quantity, and total for all voids, returns, comps, and exchanges.
Related Report: Adjustments Report
Updated 10/03/2022

Summary
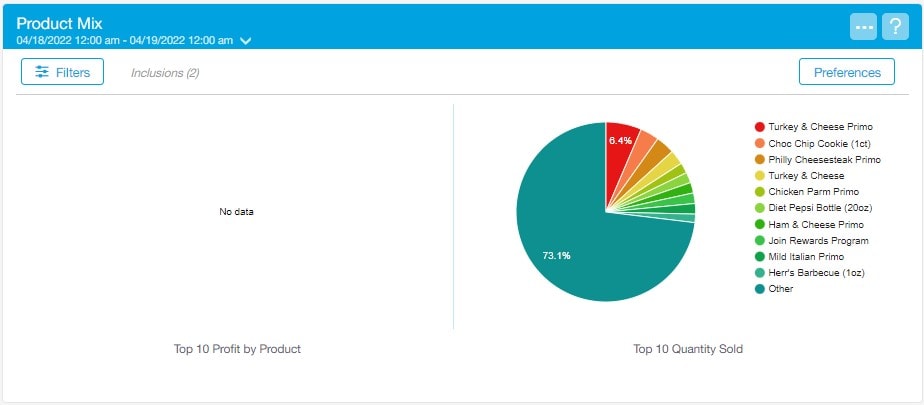
The Product Mix Report shows the breakdown of each product's sales. It is a powerful tool designed to provide insight on the best-selling and most profitable products. The pie chart shows the top 10 products, either by product profit (currently not used) or by quantity sold. There will be a large portion of the Top 10 Quantity Sold that is assigned to Other, which contains all products that do not fall in the top 10 slots.
From the Management Console select Reports > Product Mix.

Filtering The Report
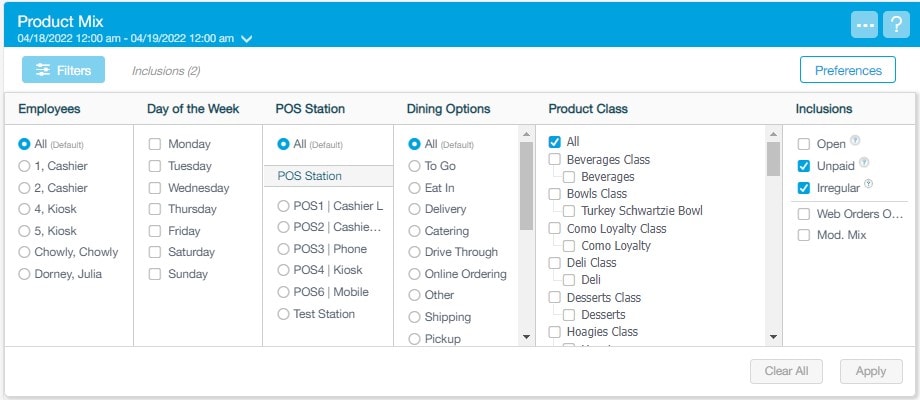
This report contains multiple filter options including filtering by Date Range dropdown, and the Filters button. Use the Filters button to choose Employees, Days of the Week, POS Stations, Dining Options, Product Classes, & Inclusions you want to see in the report.
Exporting Data
Use the elipsis icon on the top right to export the reporting data to various formats or send to a printer.
Additional Preferences
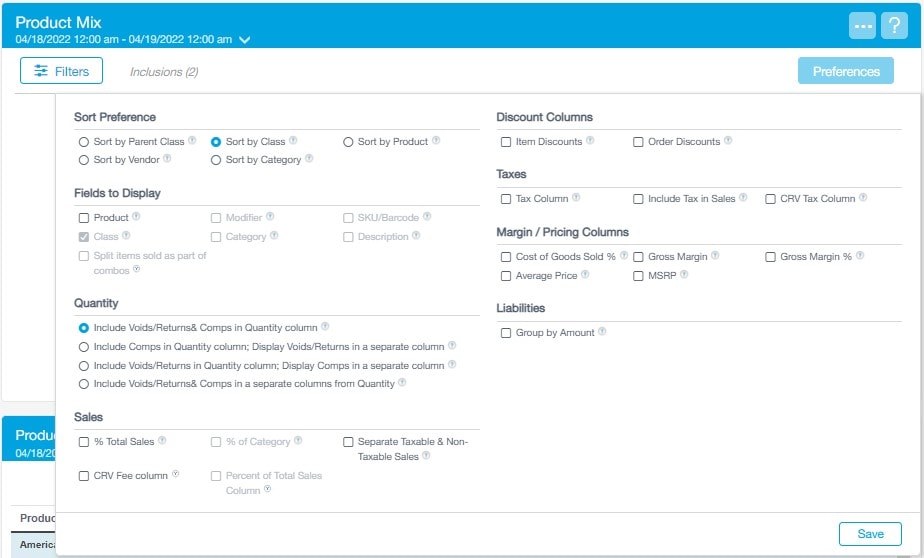
There are several details you can choose to include or exclude in the Product Mix Report.
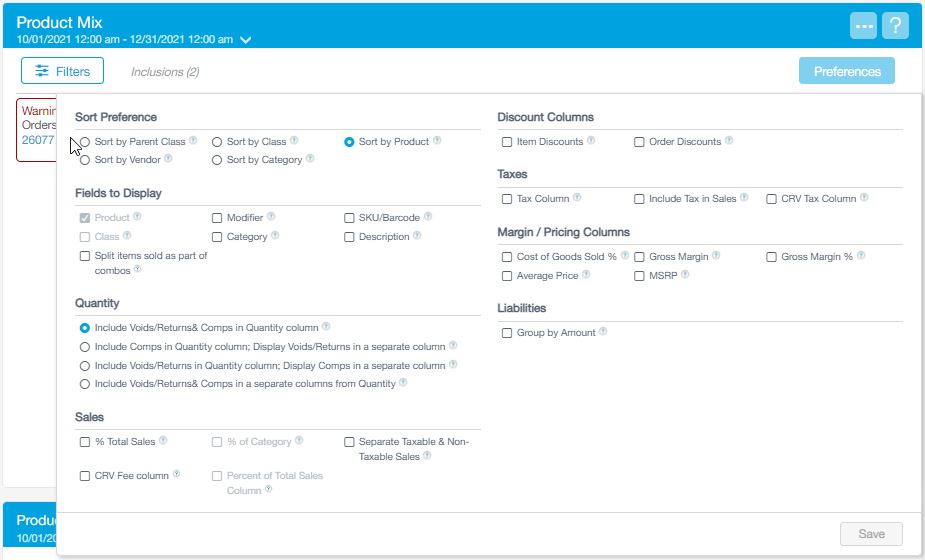
Sort Preference: The sort preference allows you to choose how products are sorted. Choose from sorting by Parent Class, Vendor, Class, Category, & Products.
Fields To Display: Choose which product details you would like to see.
Quantity: The quantity section will adjust the quantity that displays next to each product. Choose from multiple filter options which include Returns, Comps, & Exchanges.
Sales: The sales section allows you to select the sales data views from the Percent Total Sales, Percent of Category, Percent of Total Sales Column, & Separate Taxable and Non-Taxable Sales.
Discount Columns: Choose to view Item Discounts & Order Discounts.
Taxes: Choose from the Tax Column & Include Tax In Sales.
Margin/Pricing Columns: In this section you can choose from the Cost of Goods Sold Percentage, Average Price, Gross Margin, MSRP, & Gross Margin Percentage.
Liabilities: Choose to Group By Amount.
Pie Charts
The left side of this section shows the Top 10 Profit By Product Pie Chart. This is currently unavailable as we are not entering COG into Revel at this time. The right side of this section shows the Top 10 Quantity Sold Pie Chart. This pie chart is a great way to quickly see your most popular sold products during the selected timeframe.
Report Data
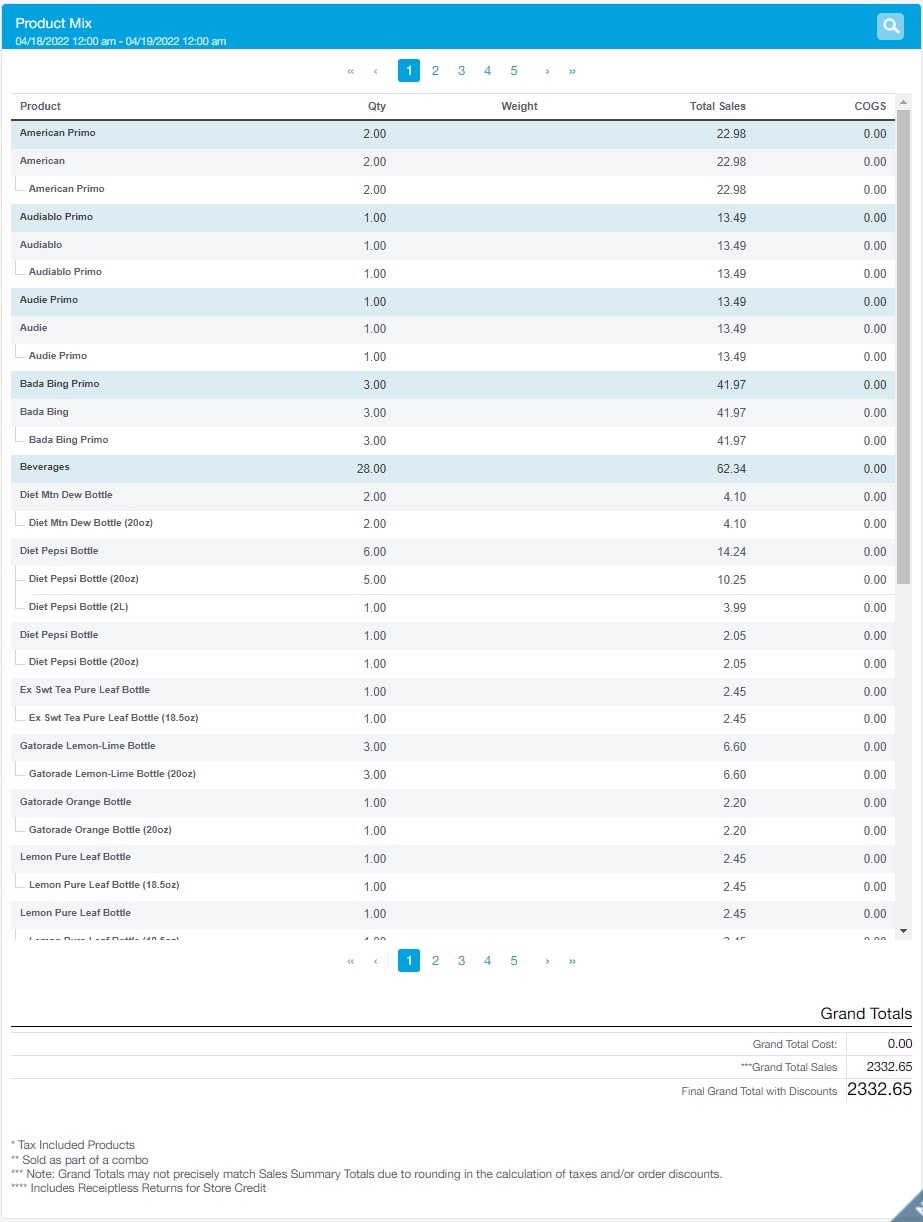
Once you have filtered your report and adjusted your preferences, the Product Mix Report is generated. To search for a specific product, use the search field on the top right of the report.
If you include products and modifiers in your report, the total displayed for each modifier will be the number of products with that modifier sold. If more than one modifier has been added to a particular product, the total number of products sold and the total number of modifiers sold won't be the same on your report.
For instance, if your modifier is Primo Toppings, and you sold one Bada Bing Primo size hoagie with Hot Peppers, Onions, and Broccoli Rabe, your report will show one Bada Bing Primo size hoagie sold under products and one each sold of Hot Peppers, Onions, and Broccoli Rabe under modifiers. Your modifiers add up to three, but only one hoagie was sold, so the total under products will still be one. This allows you to accurately track and compare modifier sales.
Updated 10/03/2022

Summary
Holiday bonus cards can be issued from the point of sale. Each holiday season, $5 and $25 holiday bonus cards are pre-programmed with their respective values before being shipped out to the establishments. The holiday bonus cards are valid for redemption from January 1st to February 28th.
When a customer purchases a regular $25 gift card, they will receive a complimentary $5 holiday bonus card. When $100 in regular gift cards are purchased, they will receive a $25 holiday bonus card. For the entire process, refer to the Holiday Bonus Cards guide.
At the end of the holiday season, the establishment will be required to return any holiday bonus cards that have not been distributed back to PrimoHoagies Corporate.
From the Management Console select Reports > Product Mix.

Filtering The Report
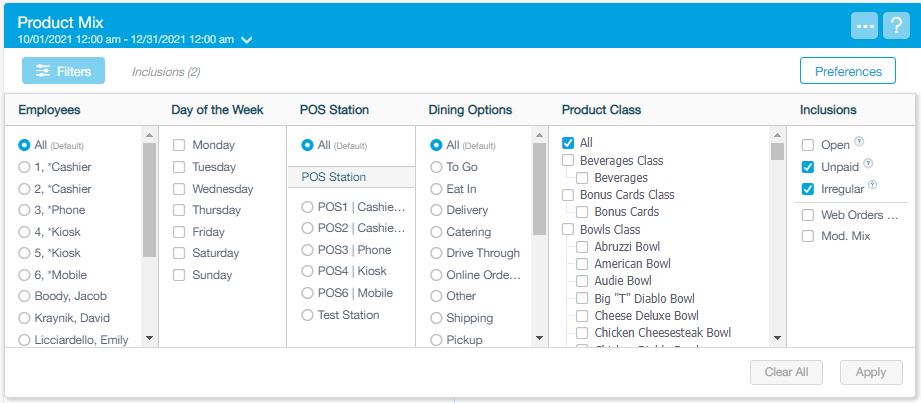
This report contains multiple filter options including filtering by Date Range dropdown, and the Filters button. Select the date range from the dropdown (example: October 1st to January 1st). Use the Filters button to choose Employees, Days of the Week, POS Stations, Dining Options, Product Classes, & Inclusions you want to see in the report. For this report, each section can be set to the defaults below:
Exporting Data
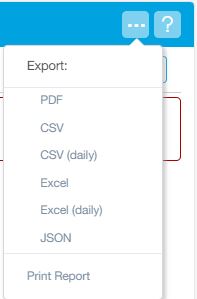
Use the elipsis icon on the top right to export the reporting data to various formats or send to a printer.
Additional Preferences
There are several details you can choose to include or exclude in the Product Mix Report. All the defaults can be kept the same however you will need to adjust the Sort Preference.
Sort Preference: The sort preference allows you to choose how products are sorted. Select the Sort by Product radio button.
Report Data
Once you have filtered your report and adjusted your preferences, the Product Mix Report is generated. To search for a specific product, use the search field on the top right of the report in the Product Mix section. For this report, type Bonus Card to filter the holiday bonus cards entered into the POS. You will need to subtract these quantities from the holiday bonus cards on hand then return the remainders to PrimoHoagies Corporate.

Updated 10/27/2022

Summary
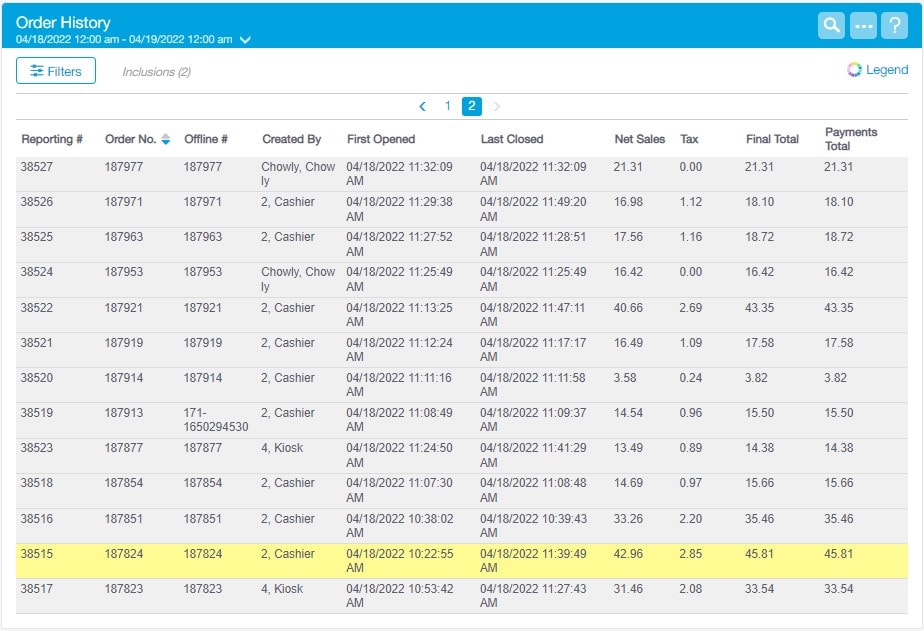
The Order History Report displays all orders taken in a given timeframe. This report allows you to see a brief overview of each order taken, including when the order was created, when it was closed, the employee that processed the transaction, the sales generated, & the payments collected for those sales. If you require more in-depth information for a particular order, you can either select the line item containing the order in question, or look up a particular order in the search field to populate the order details.
From the Management Console select Reports > Order History.

Filtering The Report
This report contains multiple filter options including filtering by Date Range dropdown, and the Filters button. Use the Filters button to choose Dining Options, Employees, & Inclusions you want to see in the report.

Exporting Data
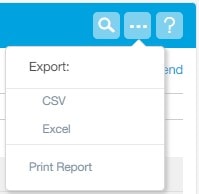
Use the elipsis icon on the top right to export the reporting data to various formats or send to a printer.
Legend
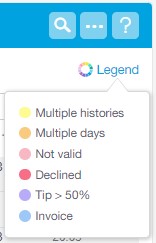
Select the Legend icon for definitions of the different colors that appear in the report.
Report Data
The various components of the report are described in detail here:
Reporting #: The reporting number is reflective of the order in which the orders were taken on that particular establishment. It is designed for clients with more than one location that require consecutive order numbers for tax purposes.
Order No.: The order number is reflective of the order in which the orders were taken on that brand. Clients with more than one location will notice that an order number may skip from 100 to 201 for one of the locations, only to find order number 101 in another. Order numbers are shared across all establishments. Sometimes order numbers may skip even in businesses with just one establishment. This is because an order had been created, but then all products were deleted and the order was cancelled on the point of sale. Revel marks the cancelled order as an order on its servers regardless, but will not display it in the order history. If you require consecutive numbering, you should rely on Reporting # instead.
Offline #: The offline number is reflective of the order number if it is processed offline. The Order No. and Offline # match the majority of the time. However, if the Order No. and Offline # do not match, it is because the internet was down when the order was opened but was then synced to the server after the internet came back up. If you see a large number of mismatched order numbers and offline numbers, please contact your internet service provider to ensure you have a strong, consistent internet connection.
Created By: Displays the employee who created the order. This will reflect the employee who was logged in at the time the order was created. If an order was taken through Revel's Online Ordering platform (referred to as OOXT), the Created By field will display atlasadmin.
First Opened: Displays the date and time the order was created.
Last Closed: Displays the date and time the order was closed. Entries will appear as N/A if the order has not been closed.
Final Total: Displays the total dollar amount of sales including the Net Sales + Tax.
Payments Total: Displays the total amount of the payments collected.
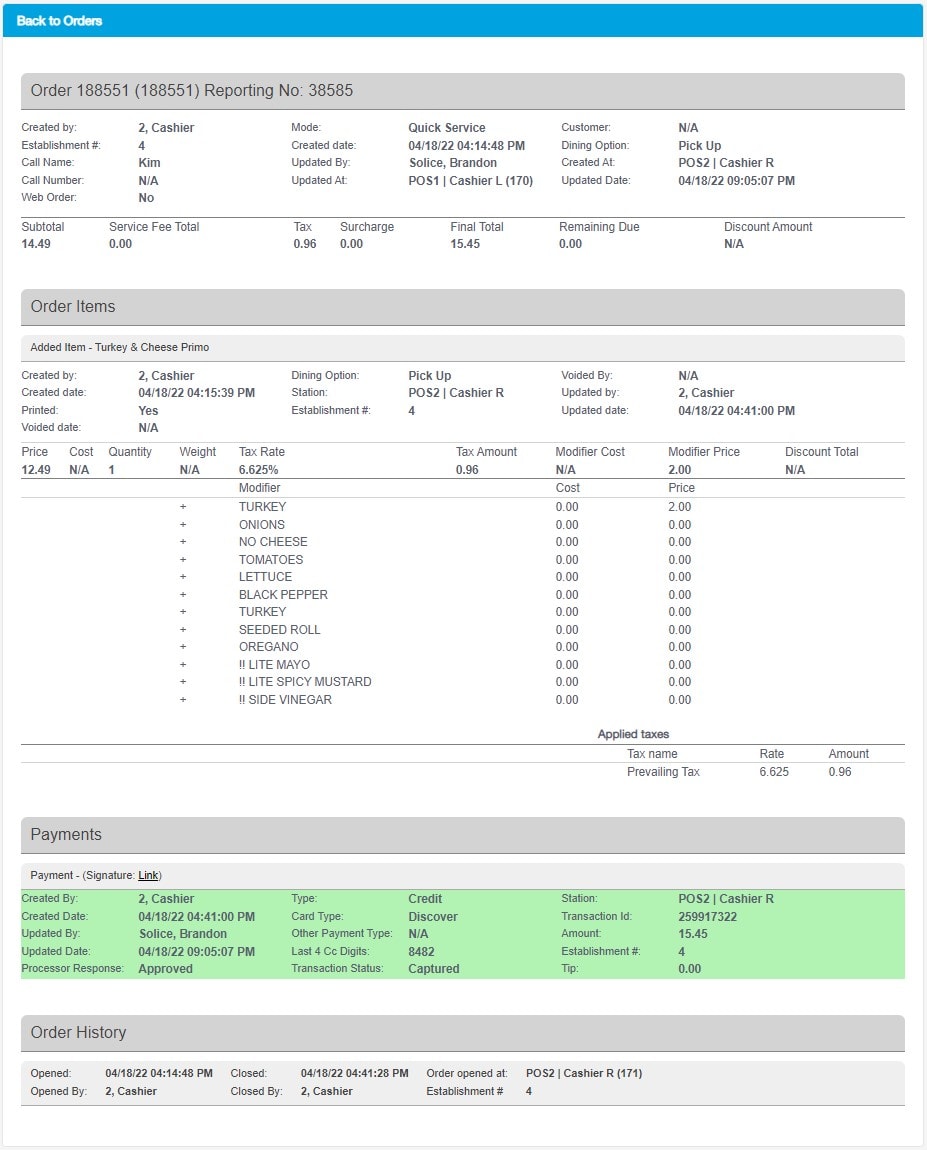
When you click an order, it opens to display all order details including a breakdown of subtotals, fees, surcharges, applicable taxes, and a detailed list of items included in the order. If you use a Customer Display Screen (referred to as a CDS) and collect signatures on the iPad, you can view the digital signature for a credit card payment by clicking the signature Link under the Payments section.
Updated 10/03/2022

Summary
The Payment Summary Report displays all payments taken. It is the same as the payment section of the Sales Summary Report, but this report includes a list of all payments taken and refunded.
From the Management Console select Reports > Payment Summary.

Filtering The Report
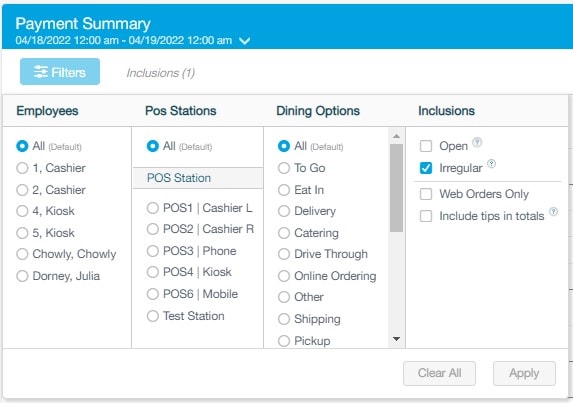
This report contains multiple filter options including filtering by Date Range dropdown, and the Filters button. Use the Filters button to choose Employees, POS Stations, Dining Options, & Inclusions you want to see in the report.
Exporting Data
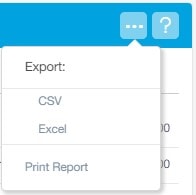
Use the elipsis icon on the top right to export the reporting data to various formats or send to a printer.
Report Data
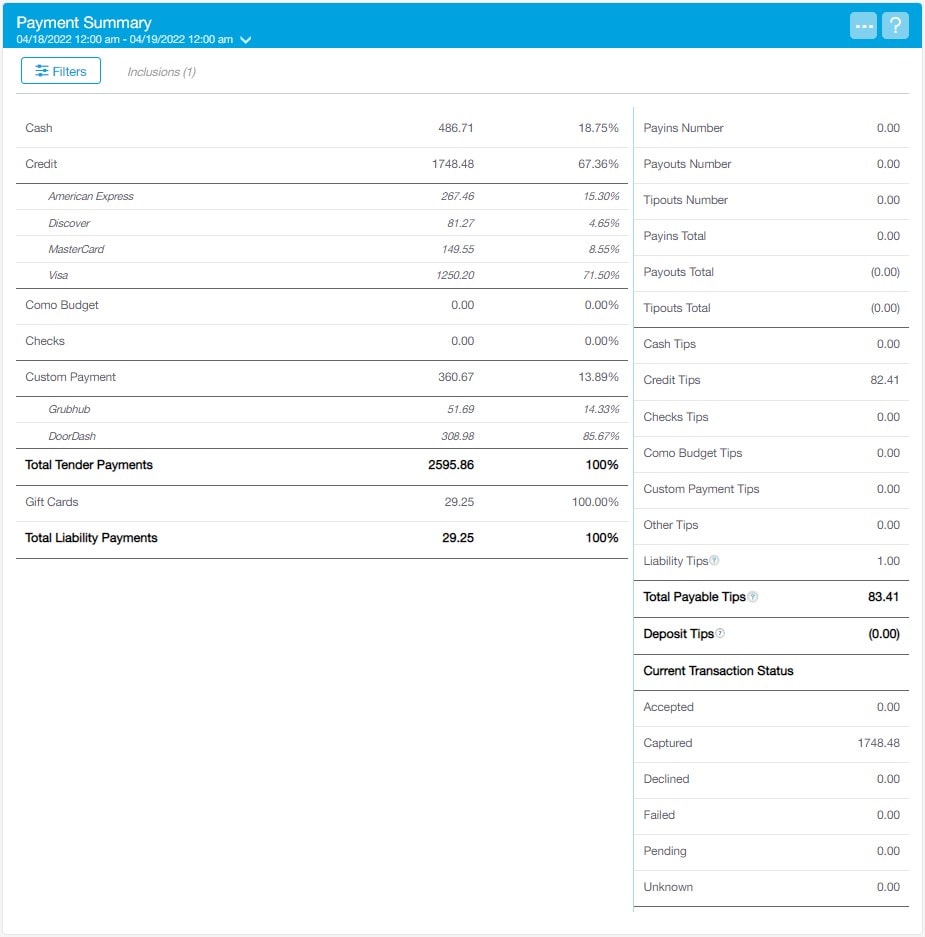
The main Payment Summary Report breaks down a summary of the payment types made during the given timeframe.
Cash: The total cash payments including refund and excluding tips.
Credit: Sum total of all credit payments including refunds and excluding tips.
Checks: Total check payments, including refunds and excluding tips.
Custom Payments: Total of custom payments, including refunds and excluding tips.
Total Tender Payments: Displays total amount of all payment types accepted.
House Account: Total house account activity, including payments made with and against house accounts.
Applied Deposits: Total applied deposits, including refunds. Deposits are considered applied when the invoice is changed into an order (this conversion happens automatically overnight on the day the order is due and will print a prep ticket to the slicer printer), causing the sales to be realized.
Total Liability Payments: Displays total of all liability payments accepted.
Payins Number Total number of payins to the till.
Payouts Number: Total number of payouts to the till.
Payins Total: Total number and value of payins to the till.
Payouts Total: Total number and value of payouts to the till.
Cash Tips: Total cash tips.
Credit Tips: Total credit tips.
Checks Tips: Total checks tips.
Custom Payment Tips: Total custom payment tips.
Other Tips: Total tips from all other payment types.
Liability Tips: Total amount of tips from liability payments, including gift cards, house accounts, and applied deposits.
Total Payable Tips: The total amount of tips from all kinds of payments payable to employees.
Deposit Tips: Total tips made as deposits on invoices. These tips will become payable tips when the invoice is turned into an order.
Current Transaction Status of Accepted: Total payments sent to payment processor that have not yet been captured.
Current Transaction Status of Captured: Total payments captured and deposited to your bank account.
Current Transaction Status of Declined: Total payments declined by payment processor.
Current Transaction Status of Failed: Total payments that failed to send to payment processor.
Current Transaction Status of Pending: Total payments pending to be sent to payment processor.
Current Transaction Status of Unknown: Total payments with unknown status.
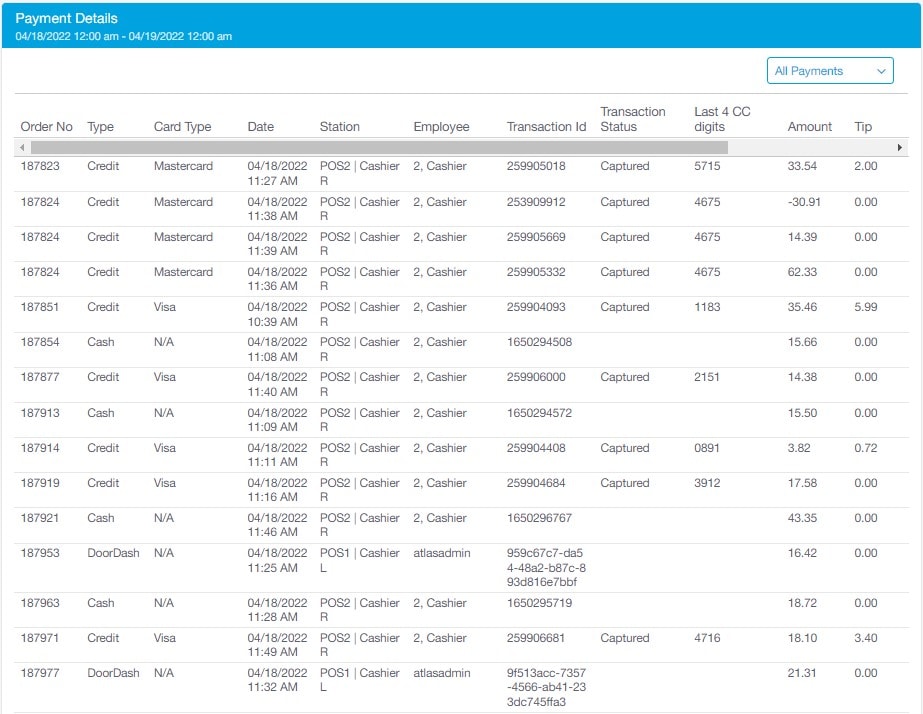
Additionally, the Payment Details section breaks down the payments further and can be filtered using the dropdown on the top right of the report. Selecting an order will take you to the associated Order History Report details.
All Payments Menu: Use this filter to view All Payments, Credit Card Payments, Liability Payments, or Cash Payments.
Order No.: The unique order number assigned to the payment.
Type: The type of payment accepted.
Card Type: The type of card brand used if the payment was made with a credit card.
Date: The date the payment was made.
Station: The point of sale station where the payment was taken.
Transaction ID: The unique transaction ID for the payment.
Transaction Status: If the payment type was a credit card, this column will display the card payment status (accepted, captured, declined).
Last 4 CC Digits: If the payment type was a credit card, this column will display the last 4 credit card digits.
Amount: The amount of the payment, excluding the tip.
Tip: The total amount of the tip, if a tip was left.
Total: The total amount of the payment plus the tip.
Updated 10/03/2022

Summary
The Discounts Report houses all Item Discounts, Order Discounts, Exchange Discounts, & Coupon transactions made on the point of sale. Revel discounts will always be one of two types, Item Discounts or Order Discounts.
From the Management Console select Reports > Other Reports > Discounts.

Filtering The Report
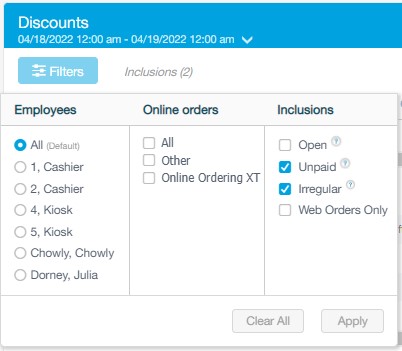
This report contains multiple filter options including filtering by Date Range dropdown, and the Filters button. Use the Filters button to choose Employees, Online Orders, & Inclusions you want to see in the report.
Exporting Data
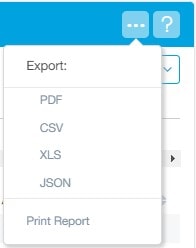
Use the elipsis icon on the top right to export the reporting data to various formats or send to a printer.
Discount Views
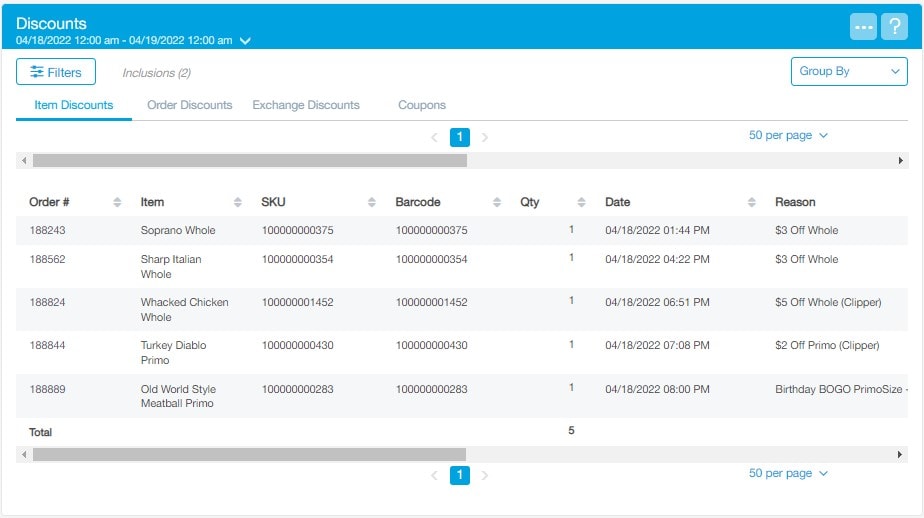
In addition to your filters, the Group By dropdown menu lets you group discounts by Order (Default), Reason, Item, & Discount Type. Discounts are also classified into four categories. These categories are Item Discounts, Order Discounts, Exchange Discounts, & Coupons.

Report Data
Selecting the discount type tab displays all available discount records. Selecting the order number will call the Order History Details Report for that order number.
Order #: The unique order number on which the discount was made.
Item: The product to which the discount was applied.
SKU: The SKU number of the product to which the discount was applied.
Barcode: the barcode of the product to which the discount was applied.
Qty: The number of that product to which the discount was applied.
Date: The date the discount was applied.
Reason: The reason entered on the POS when the discount was applied.
Type: The type of discount applied such as standard or manual. If the loyalty type is present, this indicates the discount was received through the loyalty program and is not a discount built directly into Revel.
Discount Code: Any discount code used to apply the discount.
Amount: The amount of the discount.
Order Payments: The total payment made on an order.
Tax: Displays if tax was applied.
Manager Password Used: Indicates if a manager password was required to apply the discount.
Employee: The employee that applied the discount to the order.
Updated 11/29/2023

Summary
The Products tab contains all Categories, Subcategories, Products, Modifiers, and other related components such as Discounts, Service Fees & Taxes used in the database. Everything in the Products tab is maintained by DBS and pushed out to each establishment via the corporate database or EMS (Enterprise Management System). While no changes can be made under the Products tab at the franchise level, it is still important to know how this section operates and how information is programmed for your business.
From the Management Console select Products > Products.

Product Structure
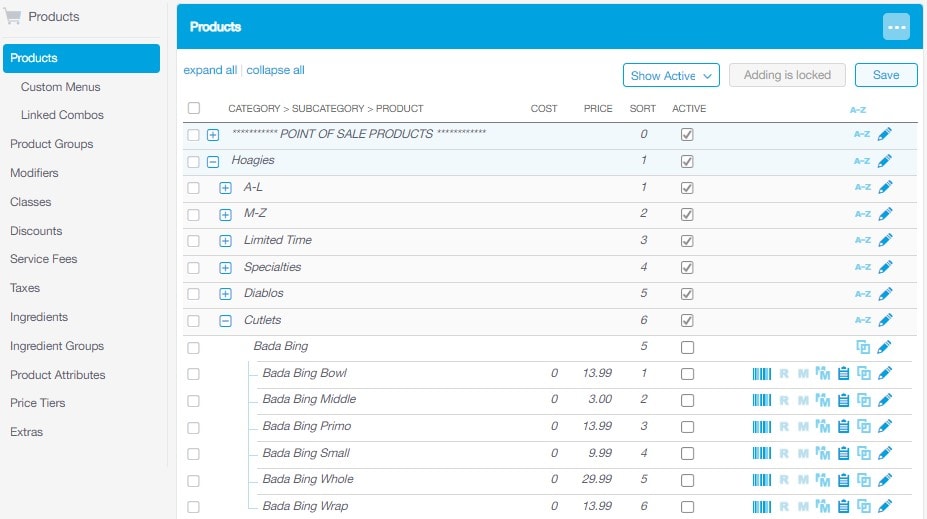
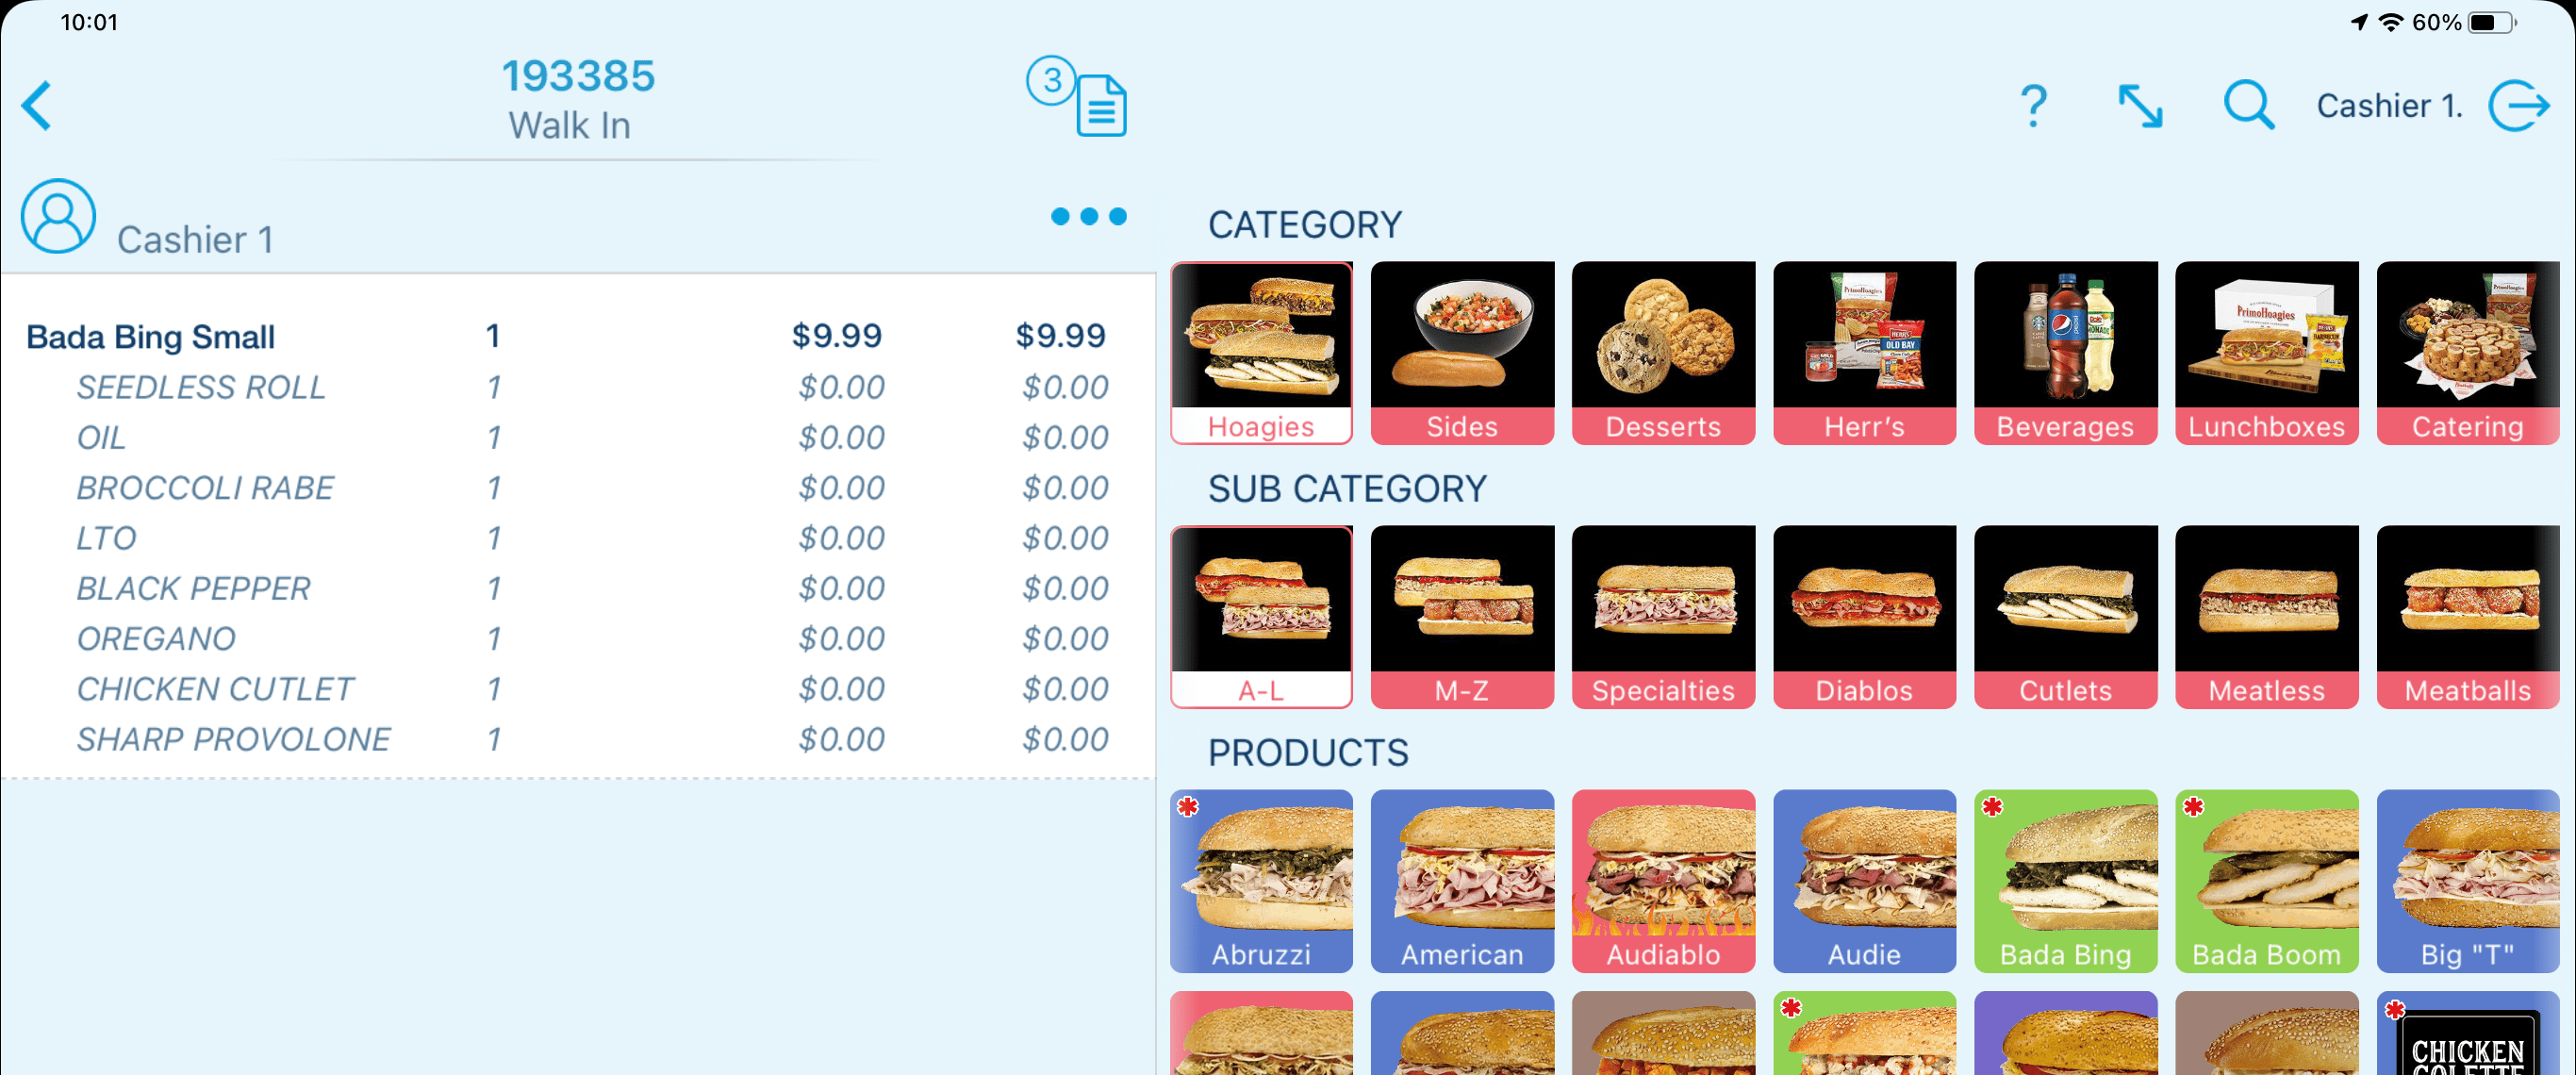
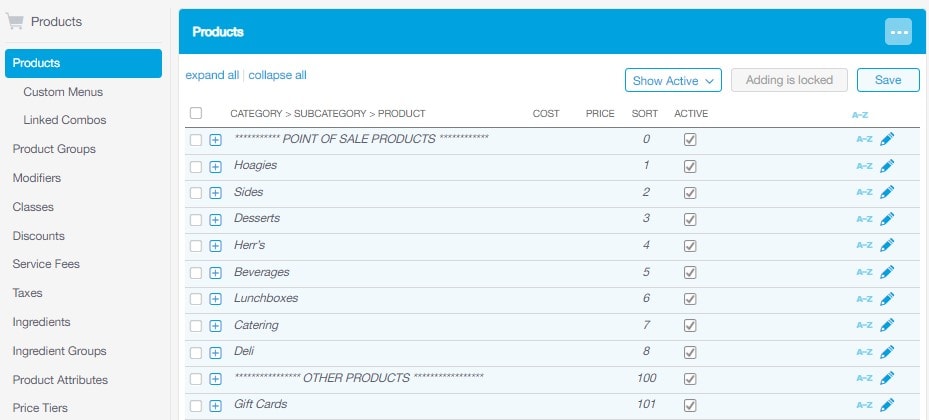
Each Product in the database is created using a Category/Subcategory structure. Categories are the broadest level of your menu such as Hoagies & Beverages. These Categories are then broken down into Subcategories such as Cutlets & Specialties or Gatorade & Pepsi Products. Each product is then created under its respective Category/Subcategory. Products can also be created under multiple Categories/Subcategories if needed. For example, the Bada Bing hoagie is created under Hoagies/Cutlets however it also appears under an “Additional Category/Subcategory” called A-L. This database structure can be seen at the POS level and allows for a Product to be visible in multiple areas.
Parent & Child Relationship
Most Products in the database are created using a Parent/Child relationship known in Revel as Matrix Products. Think of the Parent Products as being the main hoagie name with all the different sizes of hoagie variations (known as Product Attributes) being the Child Products. When ordering a hoagie, the Child Product is the actual Product that is ordered (with a dollar value) which shows on the guest check and receipts, as well as the kitchen prep ticket. The Parent Product serves as a placeholder or container for the Child Products. See the example below.

Other Products that follow this Parent/Child relationship include Herr's Chips sizes, Beverage sizes, & some Deli Products. Again, while you cannot create or edit Products, it is important to familiarize yourself with this structure so you can review the available Products and their pricing.
Product Details
By selecting the blue pencil icon next to any Category, Subcategory, or Product, you are able to view all associated details. The filtering checkboxes on the left-hand side allow for filtering which details are displayed. To look for a specific Product detail, select Clear Selections then use the search field to display any related details.

Additional Product Sections
The Products tab also contains additional configuration settings related to Products and transactions at the point of sale. Depending on you access level, you may or may not have access to view certain configuration settings. Each section and its function is described below.
Products: This is the area where all of the Categories, Subcategories, & Products are maintained.
Custom Menus: This is where Categories, Subcategories, & Products are configured to be displayed or hidden on the point of sale. In the case of scanned products such as Herr's Chips, it is typical that all Products are available at the point of sale level as Product stock changes frequently. In most cases these Products are scanned and the physical point of sale buttons are only needed for phone order lookup.
Linked Combos: Used to assign an automatic pop-up to a product. For example, if you wanted a beverage choice to prompt after each hoagie selection, this section would hold the configuration settings.
Product Groups: This area allow us to create groups of products to be used in discount creation, report filtering and the building of group combos (Hoagie Trays).
Modifiers: Contains any Modifier and its associated window. These windows are attached to Products and allow you to customize orders and provide options for your customers with just a click of a button on the point of sale. For example, dressings, toppings, spices, etc.
Classes: Used to create Class Groups for reporting.
Discounts: Contains item discounts and order discount configurations.
Service Fees: Contains Service Fees or Delivery Fees that can automatically or manually be applied to a Product or order. These fees may be passed on to the business or designated as Pass Through Fees and passed on to Employees (as tips) or 3rd Parties Delivery Services (such as Grubhub or UberEats fees).
Taxes: All taxes are configured in this section and applied to Products. This section contains Tax Groups, Individual Taxes, Flat Rate Taxes, Tax Agencies, & Tax Codes. It is the responsibility of the business to review all tax rates applied to each product and which products are taxed on non-taxed.
Ingredients: Used for Inventory and building product recipes (currently not used for PrimoHoagies).
Ingredient Groups: Contains groups of ingredients to be applied (currently not used for PrimoHoagies).
Product Attributes: This contains the variations in sizes to be used for a product. For example, the attributes of a hoagie are the sizes (Bowl, Middle, Primo, Small, Whole and Wrap). These attributes are assigned to the Child Product to create the size prompt after selecting the main Parent Product.
Price Tiers: Allows for alternative Product pricing options and can be associated with a discounts, custom menus (such as Grubhub menu), and more.
Updated 06/15/2022

Summary
Every business has employees that fill several different roles. They can range from part-time to full-time, hourly versus salaried, front of house versus back of house, etc. To accommodate the variety in personnel, Revel is able to discern between the various roles and assign specific wages to individual employees. By default, all employee POS Roles, POS Permissions, and Management Console Permissions are pre-defined in the database. You will be able to add new employees and update existing using these set parameters.
From the Management Console select Employees > Employees.

Filtering The Report
There are a few options to filter the list of employees. These include filtering by Departments & Roles as well as by Current Employees, Former Employees, Unassigned Employees (to an establishment), Inactive Employees, & All Employees. A Search Icon is also available on the top right allowing you to search by Employee Name.

Exporting Data
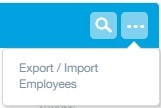
Use the elipsis icon on the top right to Export/Import the Employees (may not be available to all users).
Adding New Employees
There are a handful of employees already created with each establishment. These include the generic POS logins (example: Cashier 1, Cashier 2, Phone 3), all PrimoHoagies Corporate Field Representatives that may visit the establishments, & System Administrators from DBS and PrimoHoagies Corporate.
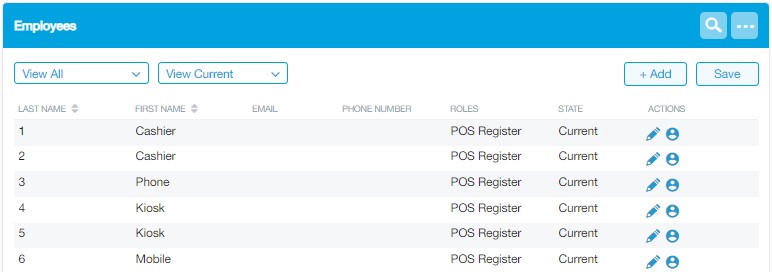
To add a new employee, select + Add and choose Add Employee from the dropdown menu. Only employees with the same access level or lower to the person adding them can be added.

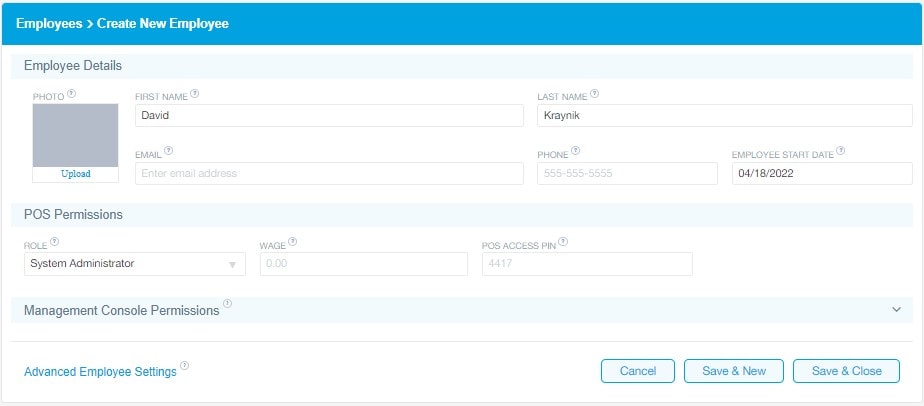
On the next window, enter the following required information.
First Name: The employee's first name.
Last Name: The employee's last name.
Employee Start Date: The first day the employee can have access to the system.
Role: The initial role the employee will be assigned. Additional roles can be assigned under the Advanced Employee Settings below.
Wage: The employee's hourly wage for the selected role. If the employee receives an hourly salary (exempt) leave this field blank and check the “Exempt” checkbox in the Advanced Employee Settings below.
POS Access PIN: This number is automatically generated for each employee and cannot be changed. The same access PIN is used by the employee at all establishments they may work at. This access PIN cannot be duplicated by any other employee, in any establishment.
Management Console Permissions
If the new employee needs access to the Revel Management Console, select the Management Console Permissions text to expand the field. An Email Address and Administrative Permissions Set is required for access. All other fields are optional and can be adjusted later. Only employees with the same access level or lower to the person adding them can be added.
Example: General Manager to General Manager Permissions

Once completed, choose the Save & New or Save & close button.
Editing Employee Details
To edit an employee already in the database, select the blue pencil icon next to the employee.
![]()
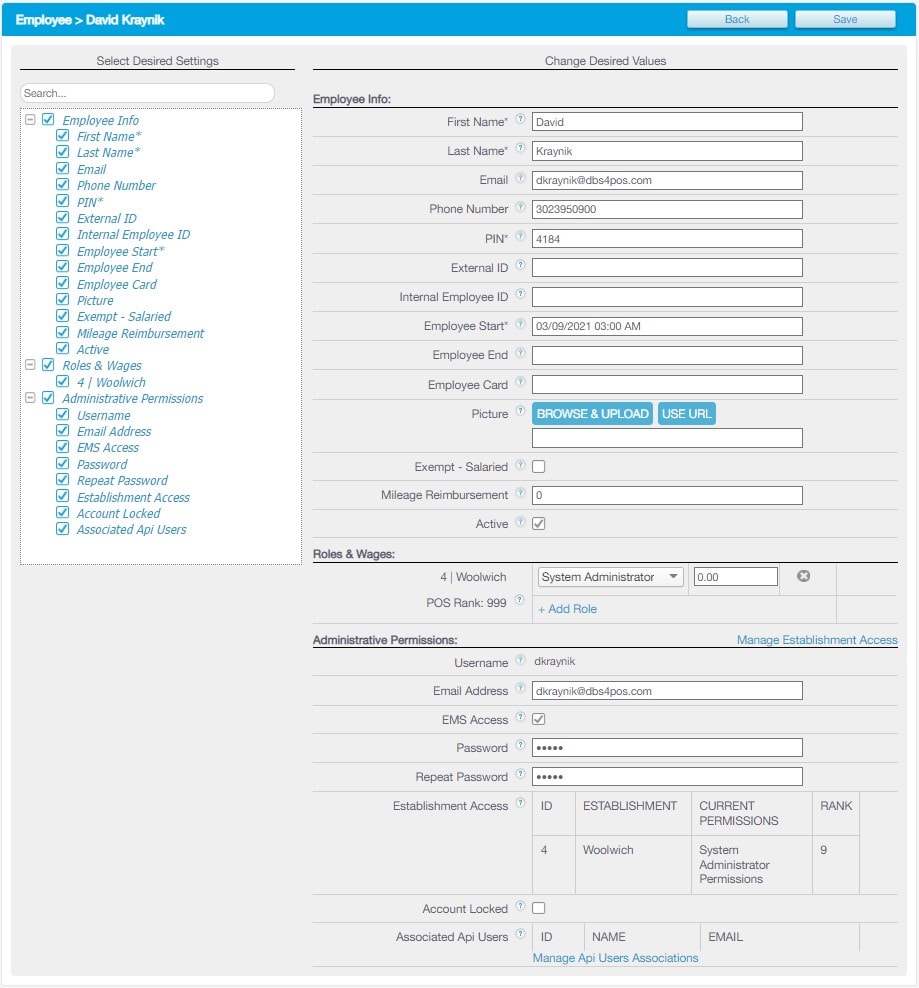
The Employee Details page displays all details associated with an individual employee. Edit any details as needed including (but not limited to) setting the employee Inactive, adjusting or adding additional Roles & Wages, adjusting Administrative Establishment Access, & more.
Updated 06/15/2022

Summary
In the Shift Schedule tab you can create, update, & view schedules for your employees. You can also use this feature to easily email schedules.
From the Management Console select Schedules > Shift Schedule.

Filtering Shift Schedules
You can adjust your view of employee schedules to suit your purposes by using the available filters as needed.
Roles: Specify which roles you want to view.
Time Format: View an employee's total hours in decimal numbers or hours and minutes.
Date: Lets you select the week you wish to view.
Copy Shifts: Lets you copy employee shifts from one week to another.
Import: Allows you to import a schedule created on an Excel spreadsheet (may not be available depending on the user role).
Show All: Shows all employees and their schedules.
Hide Empty: Hides employees with no shifts that week and overrides Show All.
Inc. Total Wages: Shows or hides a column with employees total wages for the week.
Display Roles: Shows a column with employees roles.
Export: Exports the schedule as a PDF or Excel CSV spreadsheet.
Shifts: Shows employees’ schedules by shift time.
Hours: Shows employees’ schedules by the number of hours scheduled.
Wage/Forecasting: Lets you view projected payroll and sales by day.
Breaks: Shows employee break times rather than their scheduled work hours.

Creating Shift Schedules
Creating shift schedules assist optimization and planning employee hours. In the Management Console under Schedules, select Shift Schedules and then the date range for the new schedule.
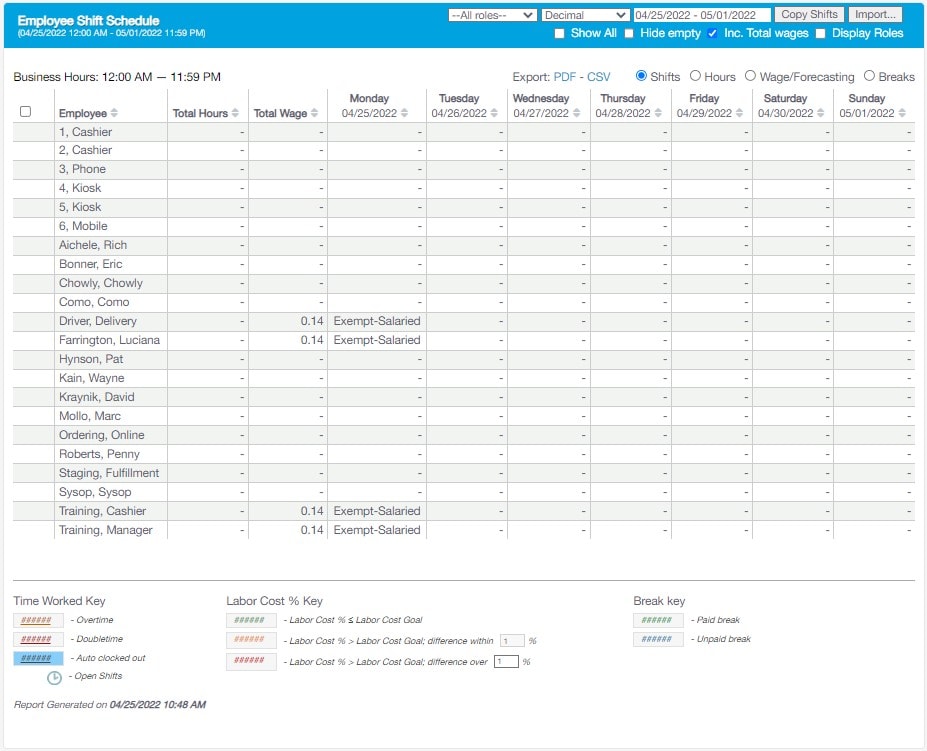
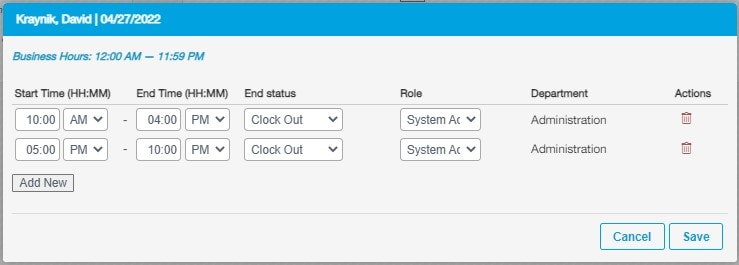
Under the desired date, click the box to the right of the employee name. Select Add New and fill in the scheduled hours for the employee. By clicking Add New, you can create another shift for the same day. Lastly, click Save. To update an existing schedule, simply select the scheduled hours under the date needing an update then make any adjustments.
Emailing Schedules
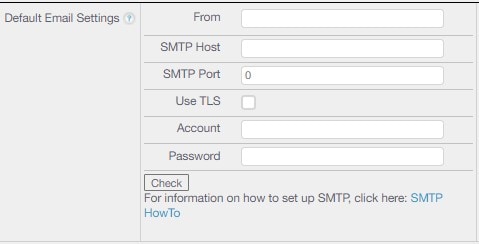
Once a schedule has been made, you can send an email to your employee. Your employee can then choose to confirm or reject their scheduled shifts. For this feature to work, default email account SMTP settings must be set by a DBS System Administrator. Please provide the appropriate information seen below to primo@dbs4pos.com with your request.
To email schedules, navigate to Shift Schedules after your employees' schedule has been created. Check the box next to the employee and select the Send Emails button below.

The employee will then receive an email with a link to view their schedule. Before your employees can accept or reject their schedule, they will have to log in using their PIN number. Below is a description of the different schedule colors seen on the Shift Schedule page.
White: No email sent.
Yellow: Email sent.
Green: Employee accepted the schedule.
Red: Employee rejected the schedule.
Copying Shift Schedules
You can copy an entire schedule or a single employee’s schedule from one week to another.
To copy the entire schedule from one week to another select the Copy Shifts button at the top left, then select the week date range. Finally, select Copy.
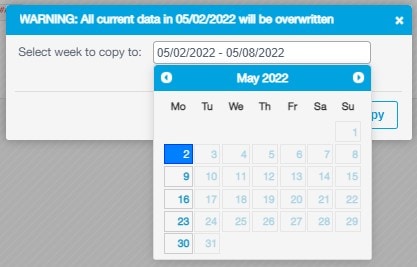
To copy an individual employees schedule from one week to the next, select the checkbox to the far left of the employee name then select the Copy Shift button below the employee list, then select the week date range. Finally, select Copy.
Updated 06/15/2022

Summary
The Time Worked Report allows managers to view the actual time worked for employees based on their clock ins/outs each week. These times are also used to calculate each employee’s wage if an hourly rate has been set for the employee.
Additionally, if an employee's clock in/out time is incorrect, you can use this report to manually adjust their time worked.
From the Management Console select Schedules > Time Worked.

Viewing the Time Worked Report
To access the Time Worked Report navigate to Schedules then Time Worked. Using the filters at the top, filter the data as needed.
All Roles: Allows filtering the Time Worked Report for specific roles or departments.
Time Format: Choose to display data either in hours worked using decimal, (3.5 hours) or HH:MM (03:30).
Date Range: By default, the Time Worked Report will be broken down weekly. If you want to change the week, select the box and select the week to view.
Hide Empty: Hides any employees with zero hours worked.
Total Wages: Displays a new column indicating employee’s total wage based on hours worked.
Display Roles: Displays the roles of each employee and how long they were clocked in and out for each role.
Export: Exports the Time Worked Report as a PDF or Excel CSV spreadsheet.
Shifts: Displays the shifts the employees clocked in and out.
Hours: Displays the exact amount of hours worked as oppose to the shift time worked.
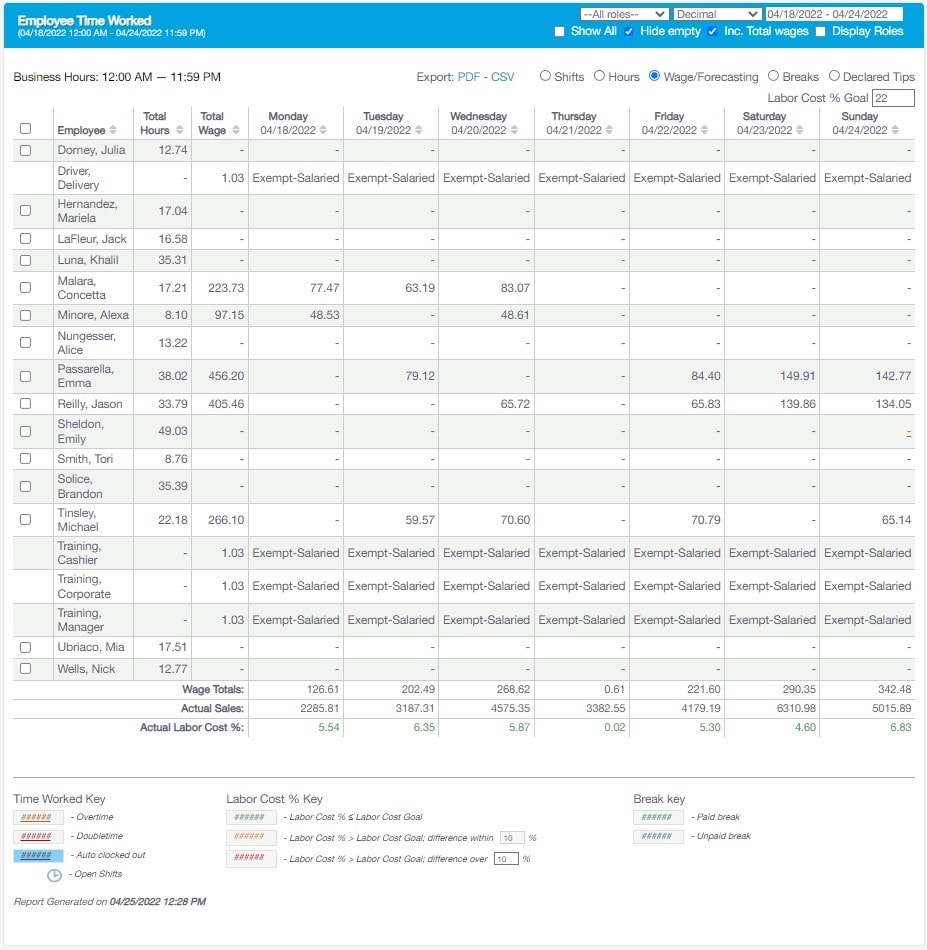
Wage/Forecasting: Displays at the bottom wage totals vs actual sales for each day. You can enter the Labor Cost % Goal when selecting this option. For this example, the labor goal is set to 22%, this means the wage totals should not exceed 22% of the actual sales. If the labor cost is below 22% of sales, the color is green. If the labor cost is more than 22% of the total sales, the color will be either orange or red. You can set the rule for the minimum and maximum costs at the bottom of the screen by indicating how big the difference is from the labor goal. For example, if the labor cost is 10% more than the labor cost goal, it will be red.
Red: Labor Cost % > Labor Cost Goal, difference over X%
All Breaks: Displays all breaks for the employee.
Manually Adjusting Time Worked
There may be times you will need to adjust your employee’s hours, whether they forgot to clock in or out for the day or for lunches and/or breaks. Employees hours can be adjusted using the Time Worked Report. From the Time Worked Report, select the box for the time worked you need to edit. A separate window will appear for you to make adjustments to the employees time. You can choose to update the Start time, End Time, End Status, or Role then add a comment in the Remarks section. Additionally, new entries can be added or existing entries can be deleted. Select Save when finished.

Updated 06/15/2022

Summary
The Payroll section gives a summary of the employee total hours and wages. Any tips accepted on the Customer Display, Online ordering, etc. will be displayed in this section as well. From the Management Console navigate to the Schedules tab and select Payroll.
From the Management Console select Schedules > Payroll.

Filtering The Report
Using the available dropdowns, checkboxes and the appropriate date range, filter the Payroll Report as needed. A list of the filtering options are below.
All Roles: Allows filtering of the Payroll Report for specific roles or departments.
Decimal: Displays the data in either hours worked (3.5) or HH:MM (03:30) format.
Date Range: By default, the payroll report will be broken down weekly. If you want to change the week, please check the box and select the week you wish to view.
Custom: Select Custom to select a custom time range. Then select the start date and end date.
Show All: Displays all employees both inactive and active. The names of employees who were inactive during the date range, deactivated at a point inside the date range, or had no assigned role inside the date range will be grayed out.
Hide Empty: Hides any employees with zero hours worked.
Expand Roles: Displays the roles of each employee and time worked in each role. For example, if someone had two roles, Cashier and Slicer/Dresser.

You can export this information by selecting one of the JSON, CSV and PDF export types. Alternatively, you can select to get payroll reports in your email however these reports will be unfiltered so it is suggested to receive the CSV Excel spreadsheet so it may be manually filtered. For this functionality to be enabled, contact DBS System Administrator at primo@dbs4pos.com.
Payroll Provider Integrations
At this time, Revel can be setup to export the Payroll Report to Paychex and ADP formats. These exports will be automatically formatted to be sent to you for import into your payroll company. If you would like to have this type of export created and automatically sent to you, please provide a DBS System Administrator with the following.
Export to Paychex: Include the Paychex export format (Preview or Flex) and the Company ID as in Paychex.
Export to ADP: Include the Company Code and the ADP Report Type (Workforce Now or Total Source).
Once setup, the Paychex export will be available for manual export as well.
Updated 06/15/2022
